Optical Character Recognition in Python: Transcribing the Turing code
- 18 minsThis post is also available as an IPython notebook which may be downloaded or viewed online.
This post talks about how to do a simple Optical Character Recognition task in Python. But first, why did I want to do this in the first place?
The University of Manchester is, as I’m writing this, running a competition as part of a tie in with the forthcoming film The Imitiation Game. The film centres around Alan Turing and his time as a cryptographer at Bletchley Park near Oxford.
Appropriately enough, the competition involves decrypting (or deciphering) a set of clues which it is claimed will reveal the location where Alan Turing hid some bars of silver.
The first and third problems are straightforward enough and I’ll not spoil the competition by posting solutions here.
Let’s take a look at the second problem:
# Import PyLab to generate plots and set the default figure size
# to something a little nicer.
%pylab inline
rcParams['figure.figsize'] = (16,9)

# Use PIL and requests to fetch the second clue:
import requests
from PIL import Image

r = requests.get('http://www.maths.manchester.ac.uk/cryptography_competition_the_imitation_game/code2_full_res.png')
assert r.status_code == 200

from io import BytesIO
code2_im = Image.open(BytesIO(r.content))
Populating the interactive namespace from numpy and matplotlib
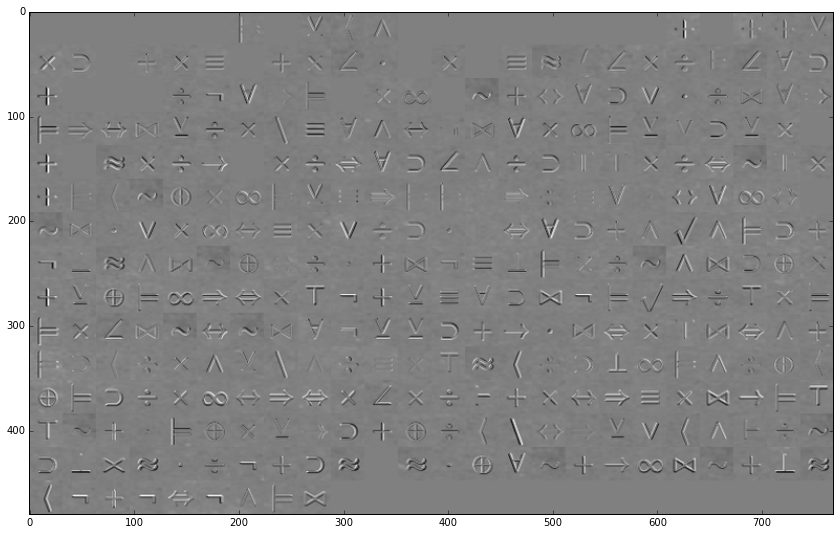
Let’s take a look at the clue:
imshow(code2_im)
<matplotlib.image.AxesImage at 0x7f0cb0374410>
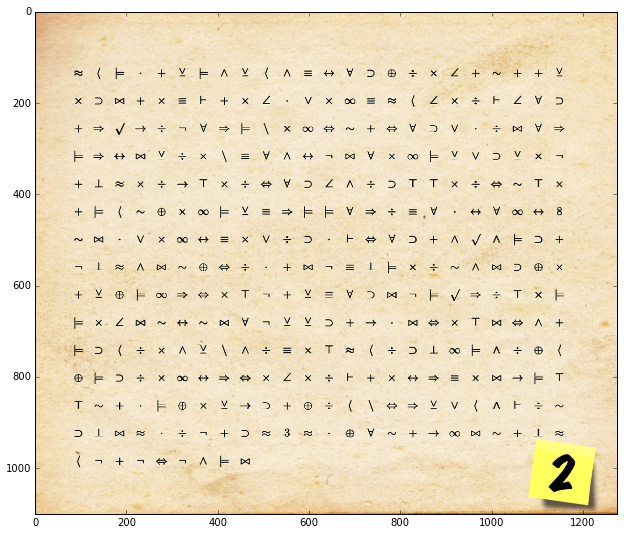
As you can see, none of the characters here are the usual alphabetic ones. There’s an eight and a three but the rest are mathematical symbols. Before I can start doing any decrypting, I need to transcribe these symbols. I could do this manually but a) I don’t know which letters to use for which symbols and b) this is highly error prone. Instead, I wondered if I could write a Python program to extract a list of symbols for me.
Extracting images for each symbol
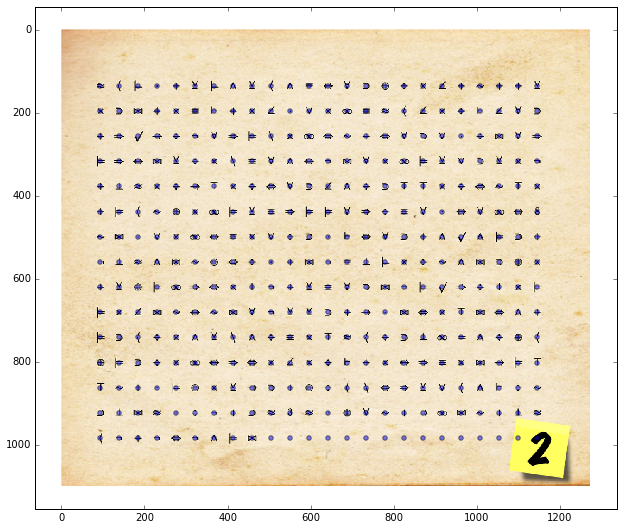
The first thing to do is snip an image containing each symbol in the input. Counting them, I see the grid is 24 symbols across and 15 down. Let’s try to form an array of centre pixel locations for each symbol. Using IPython, I can fidle around with the values below until the dots line up roughly with the symbols:
# Fiddle with these numbers a bit...
xs, ys = np.meshgrid(np.linspace(93, 1146, 24), np.linspace(135, 984, 15))

# Until these dots lie at the centres
imshow(code2_im, interpolation='none')
scatter(xs.flat, ys.flat, alpha=0.5)
<matplotlib.collections.PathCollection at 0x7f0cb02add90>
OK, those points look good. Let’s snip out 16 pixels either side of these centre points into one “region” per symbol:
# Get the image as a grayscale image
code2_grey = np.asarray(code2_im.convert('F'))

# region box "half width"
bhw = 16
regions = []
for x, y in zip(xs.flat, ys.flat):
    x, y = int(x), int(y)
    regions.append(code2_grey[y-bhw:y+bhw,x-bhw:x+bhw])

# Since the final line only has 9 symbols on it, ignore the final
# 15 regions (set them to blank)
regions = regions[:-15] + [np.zeros_like(regions[0]),] * 15

print("Number of regions: " + str(len(regions)))
Number of regions: 360
We can also write a little convenience function to view all of these snipped out regions:
def tile(mats, rows=None):
    """Tile arrays from *mats* into a larger array optionally
    specifying the number of rows.

    """
    if rows is None:
        rows = int(np.sqrt(len(mats)))
    cols = int(np.ceil(len(mats) / float(rows)))
    w, h = mats[0].shape[:2]
    out = np.zeros((rows*h, cols*w))
    for idx, m in enumerate(mats):
        r = idx // cols
        c = idx % cols
        out[r*h:(r+1)*h, c*w:(c+1)*w] = m
    return out
snipped_regions = tile(regions, rows=15)
imshow(snipped_regions, cmap='gray', clim=(0,255))
<matplotlib.image.AxesImage at 0x7f0cb0222390>
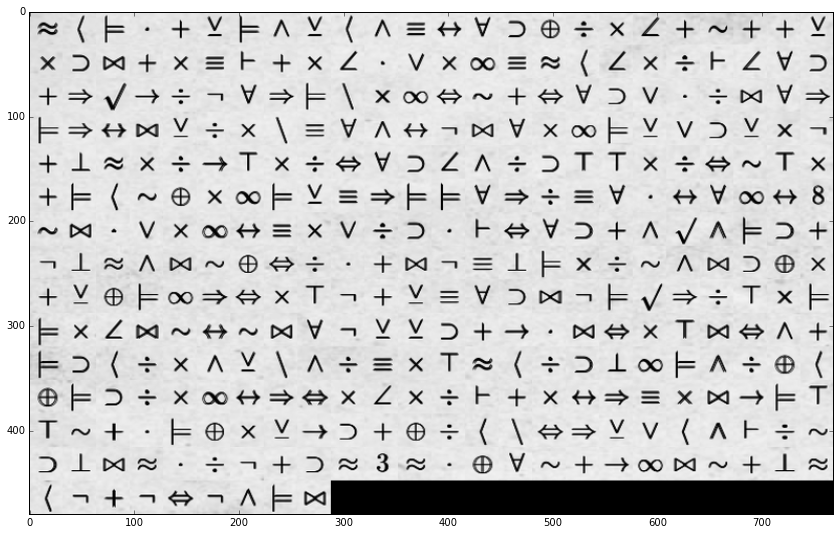
Excellent, they look nice. The next step will be to match each region to a corresponding “symbol id”.
Computing feature vectors
We can’t directly compare the pixel values in each region. It is likely that my rough centre-points are not exact and there is a non-uniform background in the image. (I.e. the “wartime paper” effect.) Instead we want to manipulate the images to exctract a vector of features which are tolerant to small shifts or small changes in intensity. Fortunately I have just a thing in my little bag of tricks a Python implementation of the Dual-Tree Complex Wavelet Transform.
It’s not required to know the specifics of the transform but see what happens if we transform the first region and one translated by one pixel:
# Create a "default" DTCWT
from dtcwt import Transform2d
dtcwt_2d = Transform2d()

# Transform the first region and that region shifted a little
t1_im = regions[0]
t1 = dtcwt_2d.forward(t1_im)
t2_im = np.roll(regions[0], -1, axis=0)
t2 = dtcwt_2d.forward(t2_im)

# Show images side-by-side
subplot(1,2,1)
imshow(t1_im, cmap='gray')
subplot(1,2,2)
imshow(t2_im, cmap='gray')
<matplotlib.image.AxesImage at 0x7f0cb01af050>

Again, the technicalities of the transform are not of interest to us here but the DTCWT converts an image into a “lowpass” (or “blurred”) low-resolution image and a set of “highpass” (or “edge-like”) complex-valued images.
Each highpass image is an array of NxMx6 complex numbers. Let’s take a look at a slice from the first symbol:
# Look at first slice of second (level "3")) highpass image
subplot(1,2,1)
imshow(np.abs(t1.highpasses[2][...,0]), interpolation='none')
subplot(1,2,2)
imshow(np.abs(t2.highpasses[2][...,0]), interpolation='none')
<matplotlib.image.AxesImage at 0x7f0cb00f6950>

Although the images have been shifted a little, the DTCWT coefficients are very similar. We’ll use this to perform matching. Firstly, transform each region into a “feature vector” consisting of the DTCWT highpass coefficients from level 3 onwards:
def compute_region_fv(region):
    t_region = dtcwt_2d.forward(region)
    return np.concatenate(list(
        np.abs(y).ravel()
        for y in t_region.highpasses[2:]
    ))

feat_vecs = np.array(list(compute_region_fv(r) for r in regions))
print("Feature vectors has shape: " + str(feat_vecs.shape))
Feature vectors has shape: (360, 96)
Matching symbols
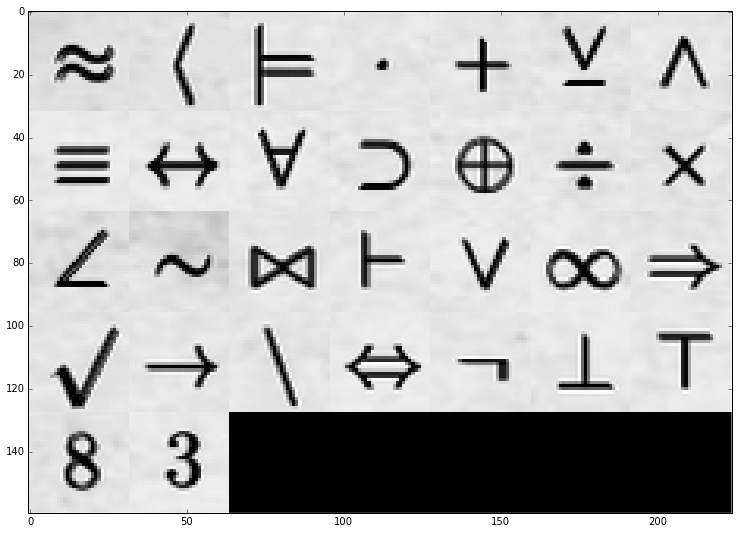
We need a set of symbols to match with and so I manually went through the image and found the indices of the first example of each kind of symbol:
# Indices of "exemplar" regions
exemplars = [
    0,1,2,3,4,5,7,11,12,13,14,15,16,17,18,
    20,26,30,35,37,49,50,51,57,60,95,97,102,143,322,
    feat_vecs.shape[0]-1, # Final "blank" region
]
print("Symbol count: " + str(len(exemplars)-1))
Symbol count: 30
Let’s look at them:
imshow(
    tile(list(regions[e_idx] for e_idx in exemplars)),
    cmap='gray', clim=(0,255), interpolation='none'
)
<matplotlib.image.AxesImage at 0x7f0cb004bfd0>
We’re going to match regions by computing the total difference between the DTCWT coefficients and those of the examplar regions. Then we’ll assign that region a symbol id based on which exemplar it is closest to.
# Compute total differences to each exemplar for each region
diffs = np.zeros((feat_vecs.shape[0], len(exemplars)))
for e_idx, r_idx in enumerate(exemplars):
    # Get exemplar's feature vectore
    e_fv = feat_vecs[r_idx:r_idx+1,:]

    # Difference from each feature vector to the exemplar
    delta = feat_vecs - np.repeat(e_fv, feat_vecs.shape[0], axis=0)

    # Compute total absolute difference
    diffs[:, e_idx] = np.sum(np.abs(delta), axis=1)

# Use Numpy's argmin function to return the index of the smallest difference
match_idx = np.argmin(diffs, axis=1)
Has it worked? Let’s find out. We’ll create a “reconstructed” image by copying the exemplar symbol for each map into the appropriate position in the output image:
synthetic_snipped_regions = tile(list(regions[exemplars[m_idx]] for m_idx in match_idx), rows=15)
imshow(synthetic_snipped_regions, cmap='gray', clim=(0,255))
<matplotlib.image.AxesImage at 0x7f0caba37e90>

That looks pretty good. What about if we compute the difference between this and the original:
imshow(synthetic_snipped_regions - snipped_regions, cmap='gray', clim=(-255,255))
<matplotlib.image.AxesImage at 0x7f0caba1d710>
Looks good. If we had got any matches wrong we would have a very strong white or black line where the matched symbol differed from the actual. The final step is to turn the match indexes into a transcription. We’ll write out the code again using the symbol index in place of the symbol:
transcription = ''
for s_idx, s in enumerate(match_idx):
    transcription += '{0:0>2} '.format(s)
    if s_idx % 24 == 23:
        transcription += '\n'
print(transcription)
00 01 02 03 04 05 02 06 05 01 06 07 08 09 10 11 12 13 14 04 15 04 04 05
13 10 16 04 13 07 17 04 13 14 03 18 13 19 07 00 01 14 13 12 17 14 09 10
04 20 21 22 12 25 09 20 02 23 13 19 24 15 04 24 09 10 18 03 12 16 09 20
02 20 08 16 05 12 13 23 07 09 06 08 25 16 09 13 19 02 05 18 10 05 13 25
04 26 00 13 12 22 27 13 12 24 09 10 14 06 12 10 27 27 13 12 24 15 27 13
04 02 01 15 11 13 19 02 05 07 20 02 02 09 20 12 07 09 03 08 09 19 08 28
15 16 03 18 13 19 08 07 13 18 12 10 03 17 24 09 10 04 06 21 06 02 10 04
25 26 00 06 16 15 11 24 12 03 04 16 25 07 26 02 13 12 15 06 16 10 11 13
04 05 11 02 19 20 24 13 27 25 04 05 07 09 10 16 25 02 21 20 12 27 13 02
02 13 14 16 15 08 15 16 09 25 05 05 10 04 22 03 16 24 13 27 16 24 06 04
02 10 01 12 13 06 05 23 06 12 07 13 27 00 01 12 10 26 19 02 06 12 11 01
11 02 10 12 13 19 08 20 24 13 14 13 12 17 04 13 08 20 07 13 16 22 02 27
27 15 04 03 02 11 13 05 22 10 04 11 12 01 23 24 20 05 18 01 06 17 12 15
10 26 16 00 03 12 25 04 10 00 29 00 03 11 09 15 04 22 19 16 15 04 26 00
01 25 04 25 24 25 06 02 16 30 30 30 30 30 30 30 30 30 30 30 30 30 30 30
Or, maybe, it’s easier if we use alphabetic characters. (Note that we’ll also end up using some punctuation since there are more than 26 symbols.)
transcription = ''
for s_idx, s in enumerate(match_idx):
    transcription += '{0} '.format(chr(65+s))
    if s_idx % 24 == 23:
        transcription += '\n'
print(transcription)
A B C D E F C G F B G H I J K L M N O E P E E F
N K Q E N H R E N O D S N T H A B O N M R O J K
E U V W M Z J U C X N T Y P E Y J K S D M Q J U
C U I Q F M N X H J G I Z Q J N T C F S K F N Z
E [ A N M W \ N M Y J K O G M K \ \ N M Y P \ N
E C B P L N T C F H U C C J U M H J D I J T I ]
P Q D S N T I H N S M K D R Y J K E G V G C K E
Z [ A G Q P L Y M D E Q Z H [ C N M P G Q K L N
E F L C T U Y N \ Z E F H J K Q Z C V U M \ N C
C N O Q P I P Q J Z F F K E W D Q Y N \ Q Y G E
C K B M N G F X G M H N \ A B M K [ T C G M L B
L C K M N T I U Y N O N M R E N I U H N Q W C \
\ P E D C L N F W K E L M B X Y U F S B G R M P
K [ Q A D M Z E K A ^ A D L J P E W T Q P E [ A
B Z E Z Y Z G C Q _ _ _ _ _ _ _ _ _ _ _ _ _ _ _
Conclusions
We’ve successfully used Python to avoid the tedium of having to transcribe a sheet of symbols by hand. Techniques such as this are used by actual OCR programs to be tolerant to small changes in character shape. Obviously I won’t be writing any more about the further decoding of this clue until after the closing date for the competition :).

Rich Wareham
You know, programming is fun!